As the election inches ever closer, memories of 2016 continue to bubble up in the minds of voters. I think it’s safe to say we all recall the idea of “Trump has no chance”. That was obviously a flawed line of thinking and although hindsight is uh…erm…2020…it’s easy to look back and see where the issues were. No one wants to ring the “Trump has no chance” bells again. Understandable. Although 2020 is starting to look like blowout territory. However, before I can explain why 2020 looks extra bad for Trump, we have to look back to how he won in 2016.
If we take the electoral map, and move 9 states into toss-up territory this is the map we have.
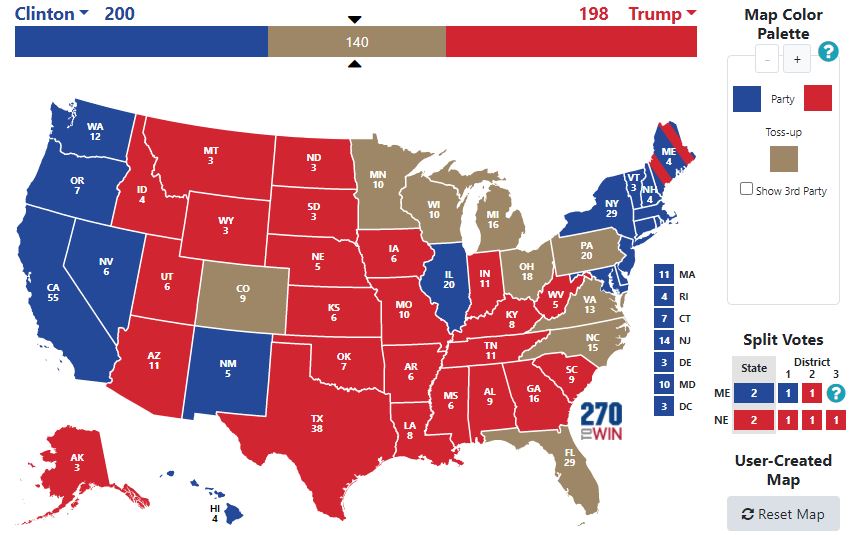
I’ve marked Minnesota and Virginia as toss-ups but they were never really in play. However, if one does this, you see that you’re at roughly a tie near 200. Now let’s look at the polling averages at that time.
| State | Polling Average |
| Virginia | Democrat +5.6% |
| Minnesota | Democrat +5.3% |
| Michigan | Democrat +4.2% |
| Colorado | Democrat +4.0% |
| Pennsylvania | Democrat +3.7% |
| Wisconsin | Republican +1.9% |
| Ohio | Republican +1.6% |
| North Carolina | Democrat +0.7% |
| Florida | Democrat +0.7% |
Based on those averages, if they all held the map would’ve looked like this.
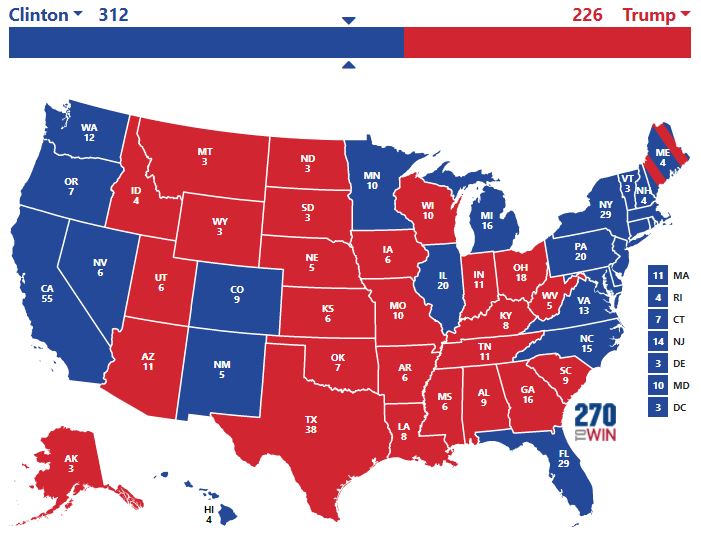
This would’ve been a Clinton victory by 86 electoral college votes. A decent win but below the average margin of victory of 130 (since 1992.) If the polls said Clinton would win by a decent margin, what happened?
A margin of error happened. Since 1972, the average margin of error for state polls in the final 21 days is about 4.75%. The average margin of error between state and national polls in the final 21 days, is about 4.8%. If we look at our swing state chart again, we can see that outside of Virginia and Minnesota, every state is polling within the margin of error.
| State | Polling Average |
| Virginia | Democrat +5.6% |
| Minnesota | Democrat +5.3% |
| Michigan | Democrat +4.2% |
| Colorado | Democrat +4.0% |
| Pennsylvania | Democrat +3.7% |
| Wisconsin | Republican +1.9% |
| Ohio | Republican +1.6% |
| North Carolina | Democrat +0.7% |
| Florida | Democrat +0.7% |
Does this mean polls are completely useless? No, of course not. On election day, 538 gave Trump about a ⅓ chance to win the election. A number of key states flipped within the margin of error (and one, way beyond it). Swings outside the margin of error are in italics. States that had a different party win then their polling average are bold.
| State | Polling Average | Result | Difference between average and result |
| Virginia | Democrat +5.6% | Democrat +5.4% | 0.2% |
| Minnesota | Democrat +5.3% | Democrat +1.5% | 3.8% |
| Michigan | Democrat +4.2% | Republican +0.3% | 3.9% |
| Colorado | Democrat +4.0% | Democrat 4.9% | 0.9% |
| Pennsylvania | Democrat +3.7% | Republican +0.6% | 2.9% |
| Wisconsin | Republican +1.9% | Republican +0.7% | 1.2% |
| Ohio | Republican +1.6% | Republican +8.1% | 6.4% |
| North Carolina | Democrat +0.7% | Republican +3.6% | 2.9% |
| Florida | Democrat +0.7% | Republican +1.2% | 1.9% |
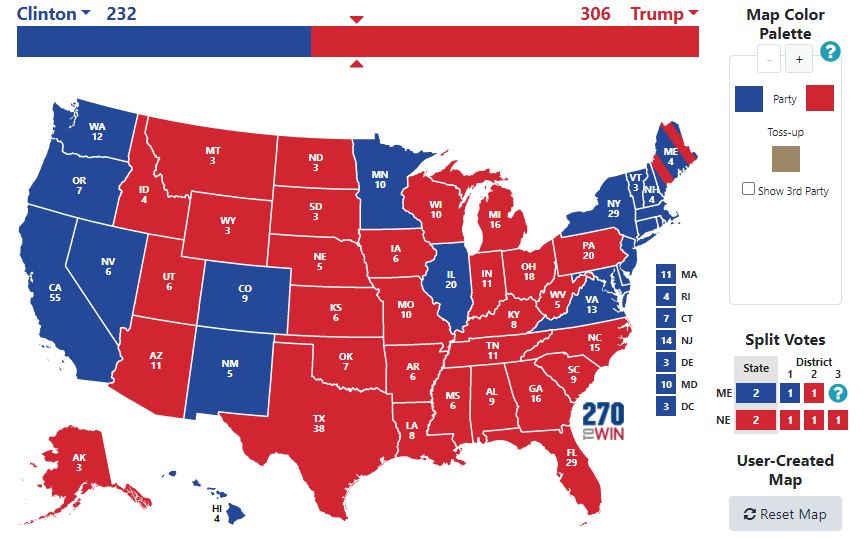
If Trump’s starting position was 198 electoral college votes, Ohio and Wisconsin held for him to get to 226 votes. The margin of error held up and flipped in the 4 bolded states which gave him another 80 votes to push him over 270. The average margin of victory in those states was 1.4%. We often overlook how close the election was, given the shock it was Trump won. However, as shown above, it was a surprise but perfectly reasonable given the provided data.
So why is 2020 different? It’s actually quite simple. Let’s look at a map where we can assign states that are outside of the 4.75% margin of error.
So we have 6 states unassigned because their polls are currently showing results within the average margin of error. Without any of those states, Biden gets to 280 and wins the election. The big difference between 2016 and 2020? Arizona, Michigan, New Mexico, and Wisconsin.
| State | Current Polls | 2016 Margin of Victory |
| Arizona | Democrat +5% | Republican +3.5% |
| Michigan | Democrat +8% | Republican +0.3% |
| Pennsylvania | Democrat +6% | Republican +0.7% |
| Wisconsin | Democrat +10% | Republican +0.7% |
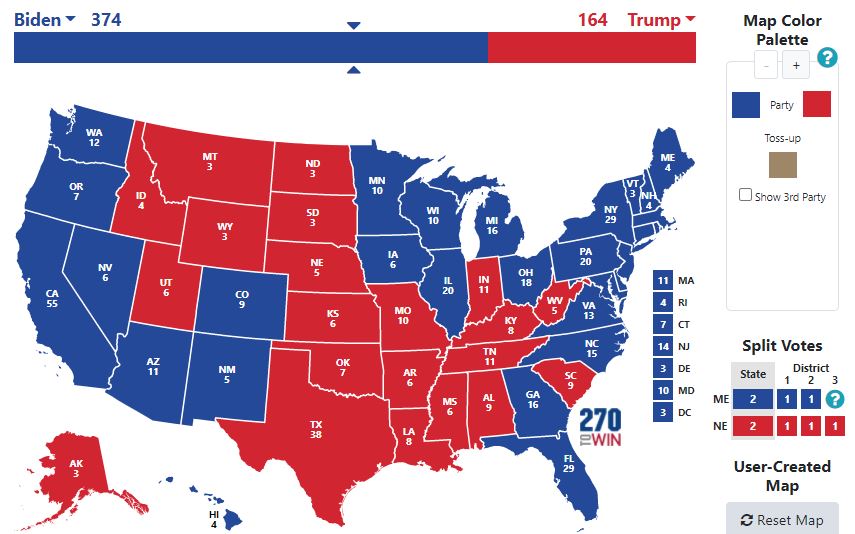
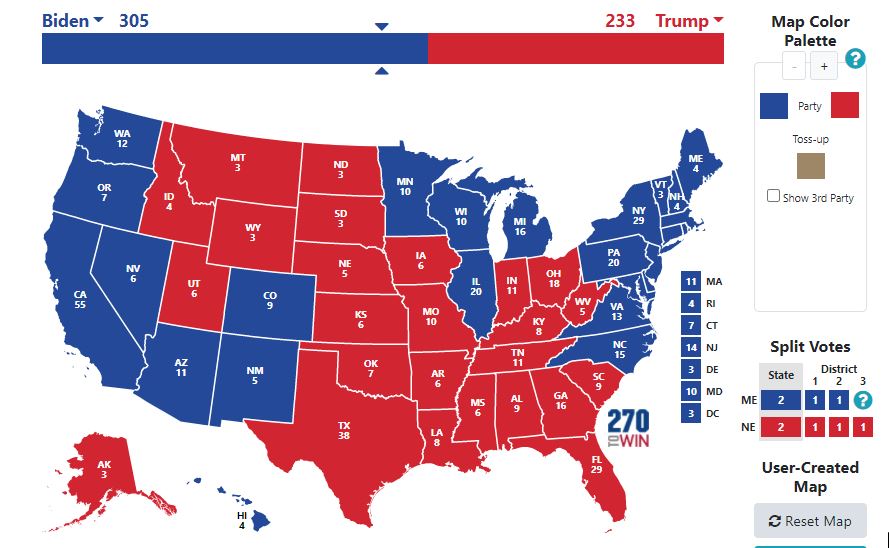
One could make the argument, given the results of 2016, that Arizona could be in play but the data doesn’t show that to be the case. If we fill in the rest of the map given the current polling, here is what it looks like.

If the poll results were to hold, this would be the map. A victory for Biden by 210 electoral college votes. The biggest margin of victory since Clinton in 1996.
Let’s reassign Iowa and Ohio because Trump won those by large margins in 2016 so those are the most likely to stay for him. Let’s also give him Florida just to see what that looks like.
I have yet to present a map that isn’t at least somewhat realistic. This one appears to be the most likely. Trump won Iowa and Ohio by a combined margin of 9 points. Texas is a state he won by 9 points. Florida is close enough for the sake of saying “how close could it be?” I have to give it to him. All of that, and it still looks like a win for Biden. A win under the average margin of victory but still a win.
So what does Trump need to do to win? Let’s review which states are within the average margin of error and then add in states that are within 2 points of that (Margin of error: 6.5%)
| State | Current Polling Average | Electoral College Votes |
| Florida | Democrat +2 | 29 |
| Georgia | Democrat +2 | 16 |
| Iowa | Democrat +3 | 6 |
| North Carolina | Democrat +4 | 15 |
| Ohio | Democrat +1 | 18 |
| Texas | Republican +2 | 38 |
| Alaska | Republican +6 | 3 |
| Arizona | Democrat +5 | 11 |
| Nevada | Democrat +6 | 6 |
| Pennsylvania | Democrat +6 | 20 |
Let’s reset our map. The only states assigned are states with a candidate currently polling at above 6.5%
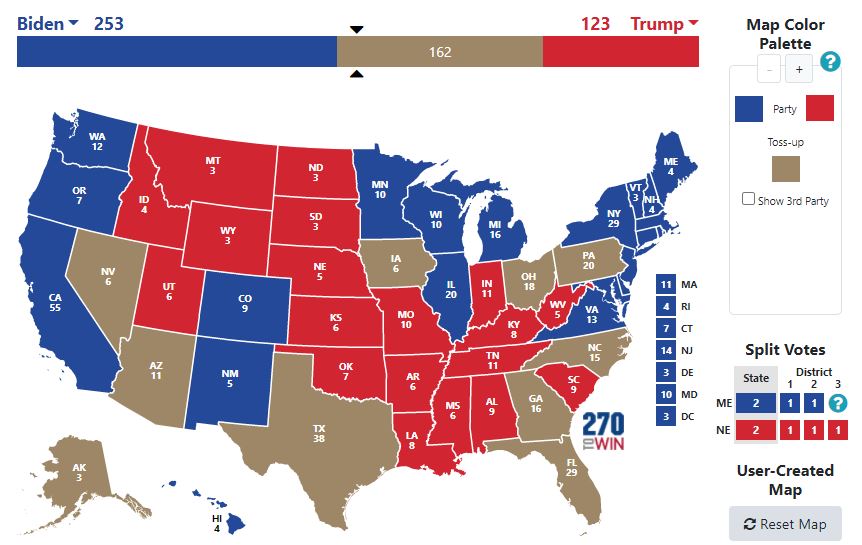
First of all, it looks ridiculous doesn’t it? We should note that this puts Biden at 253 so if Trump is going to win, it’s going to be close. Let’s assign Trump all of the current Republican states plus the states where Biden is leading within the margin of error. Keep in mind, this means flipping 5 states. He flipped 4 in 2016.
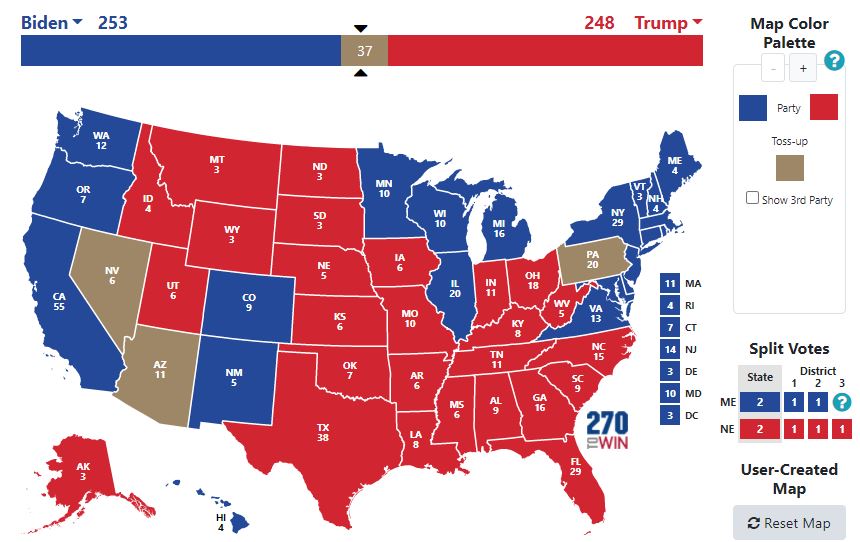
After assigning close states that Trump should win, plus giving him a comeback in 5 states he is currently losing in, this is the map. The 17 combined votes of Arizona and Nevada give Biden 270 and the win. Trump would have to also win Pennsylvania. He won it in 2016 by 0.6%, beating the polls by 2.9%. This time, he would need to beat the polls by about 6%. If that sounds like a long shot, it’s because it is.
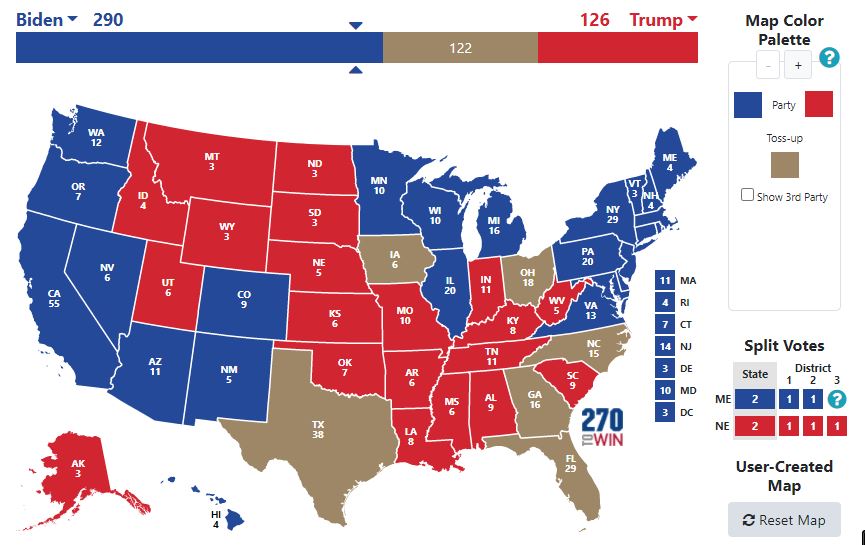
At the time of the authoring of this article, it appears that a Biden landslide (a win over the average margin of victory of 122) is more likely than just a Biden win. A Biden win is still more likely than a Trump win.
What are the outliers that could swing this from Trump? A significant polling error. A polling error of about 7% would greatly benefit him but that has happened just once since 1972 and that was the 1980 election.
This doesn’t mean it’s a safe win. I encourage everyone to vote. There are way more races than this one on the ballot and most are meaningful so exercise your right as an American. Vote.